
Well planning and drilling is a highly complex procedure that incorporates several factors and parameters to ensure maximum productivity. Amongst these, the Rate of Penetration (ROP) is a key metric that measures the speed at which a drill bit cuts through the rock to deepen the borehole.
Maximizing the ROP is a persistent challenge faced by the industry since it is influenced by several geological uncertainties and uncontrolled operational factors. However, with a data-driven approach, it is possible to predict and optimize the ROP to significantly reduce the costs and drilling time.
Halliburton Landmark’s innovative and unique detection system (Figure 1) uses advanced data analytics, Machine Learning, and Artificial Intelligence to analyse real-time well information. This combined approach helps predict the optimal ROP with high accuracy and to achieve the best possible results.
So how does it all come together?
Analysis of historical and offset drilling data is used to predict the optimum ROP and other associated parameters required to achieve the optimal value. This analysis is done by considering downhole and physics-based models. ROP logs serve as historical records of drilling performance that can aid in optimizing planning, drilling operations and formation evaluation. The input data, including the various features and the response, are visualized, cleaned, analysed and refined to use in the regression task.
Machine learning algorithms help to predict and prescribe the optimal ROP during the planning phase to reduce time during real-time execution. In addition, the algorithms also provide other recommended parameters (Figure 2) to achieve maximum ROP while drilling. Supervised machine learning algorithms are used to predict the ROP based on the drilling mechanics, well survey, hole size and lithological parameters.
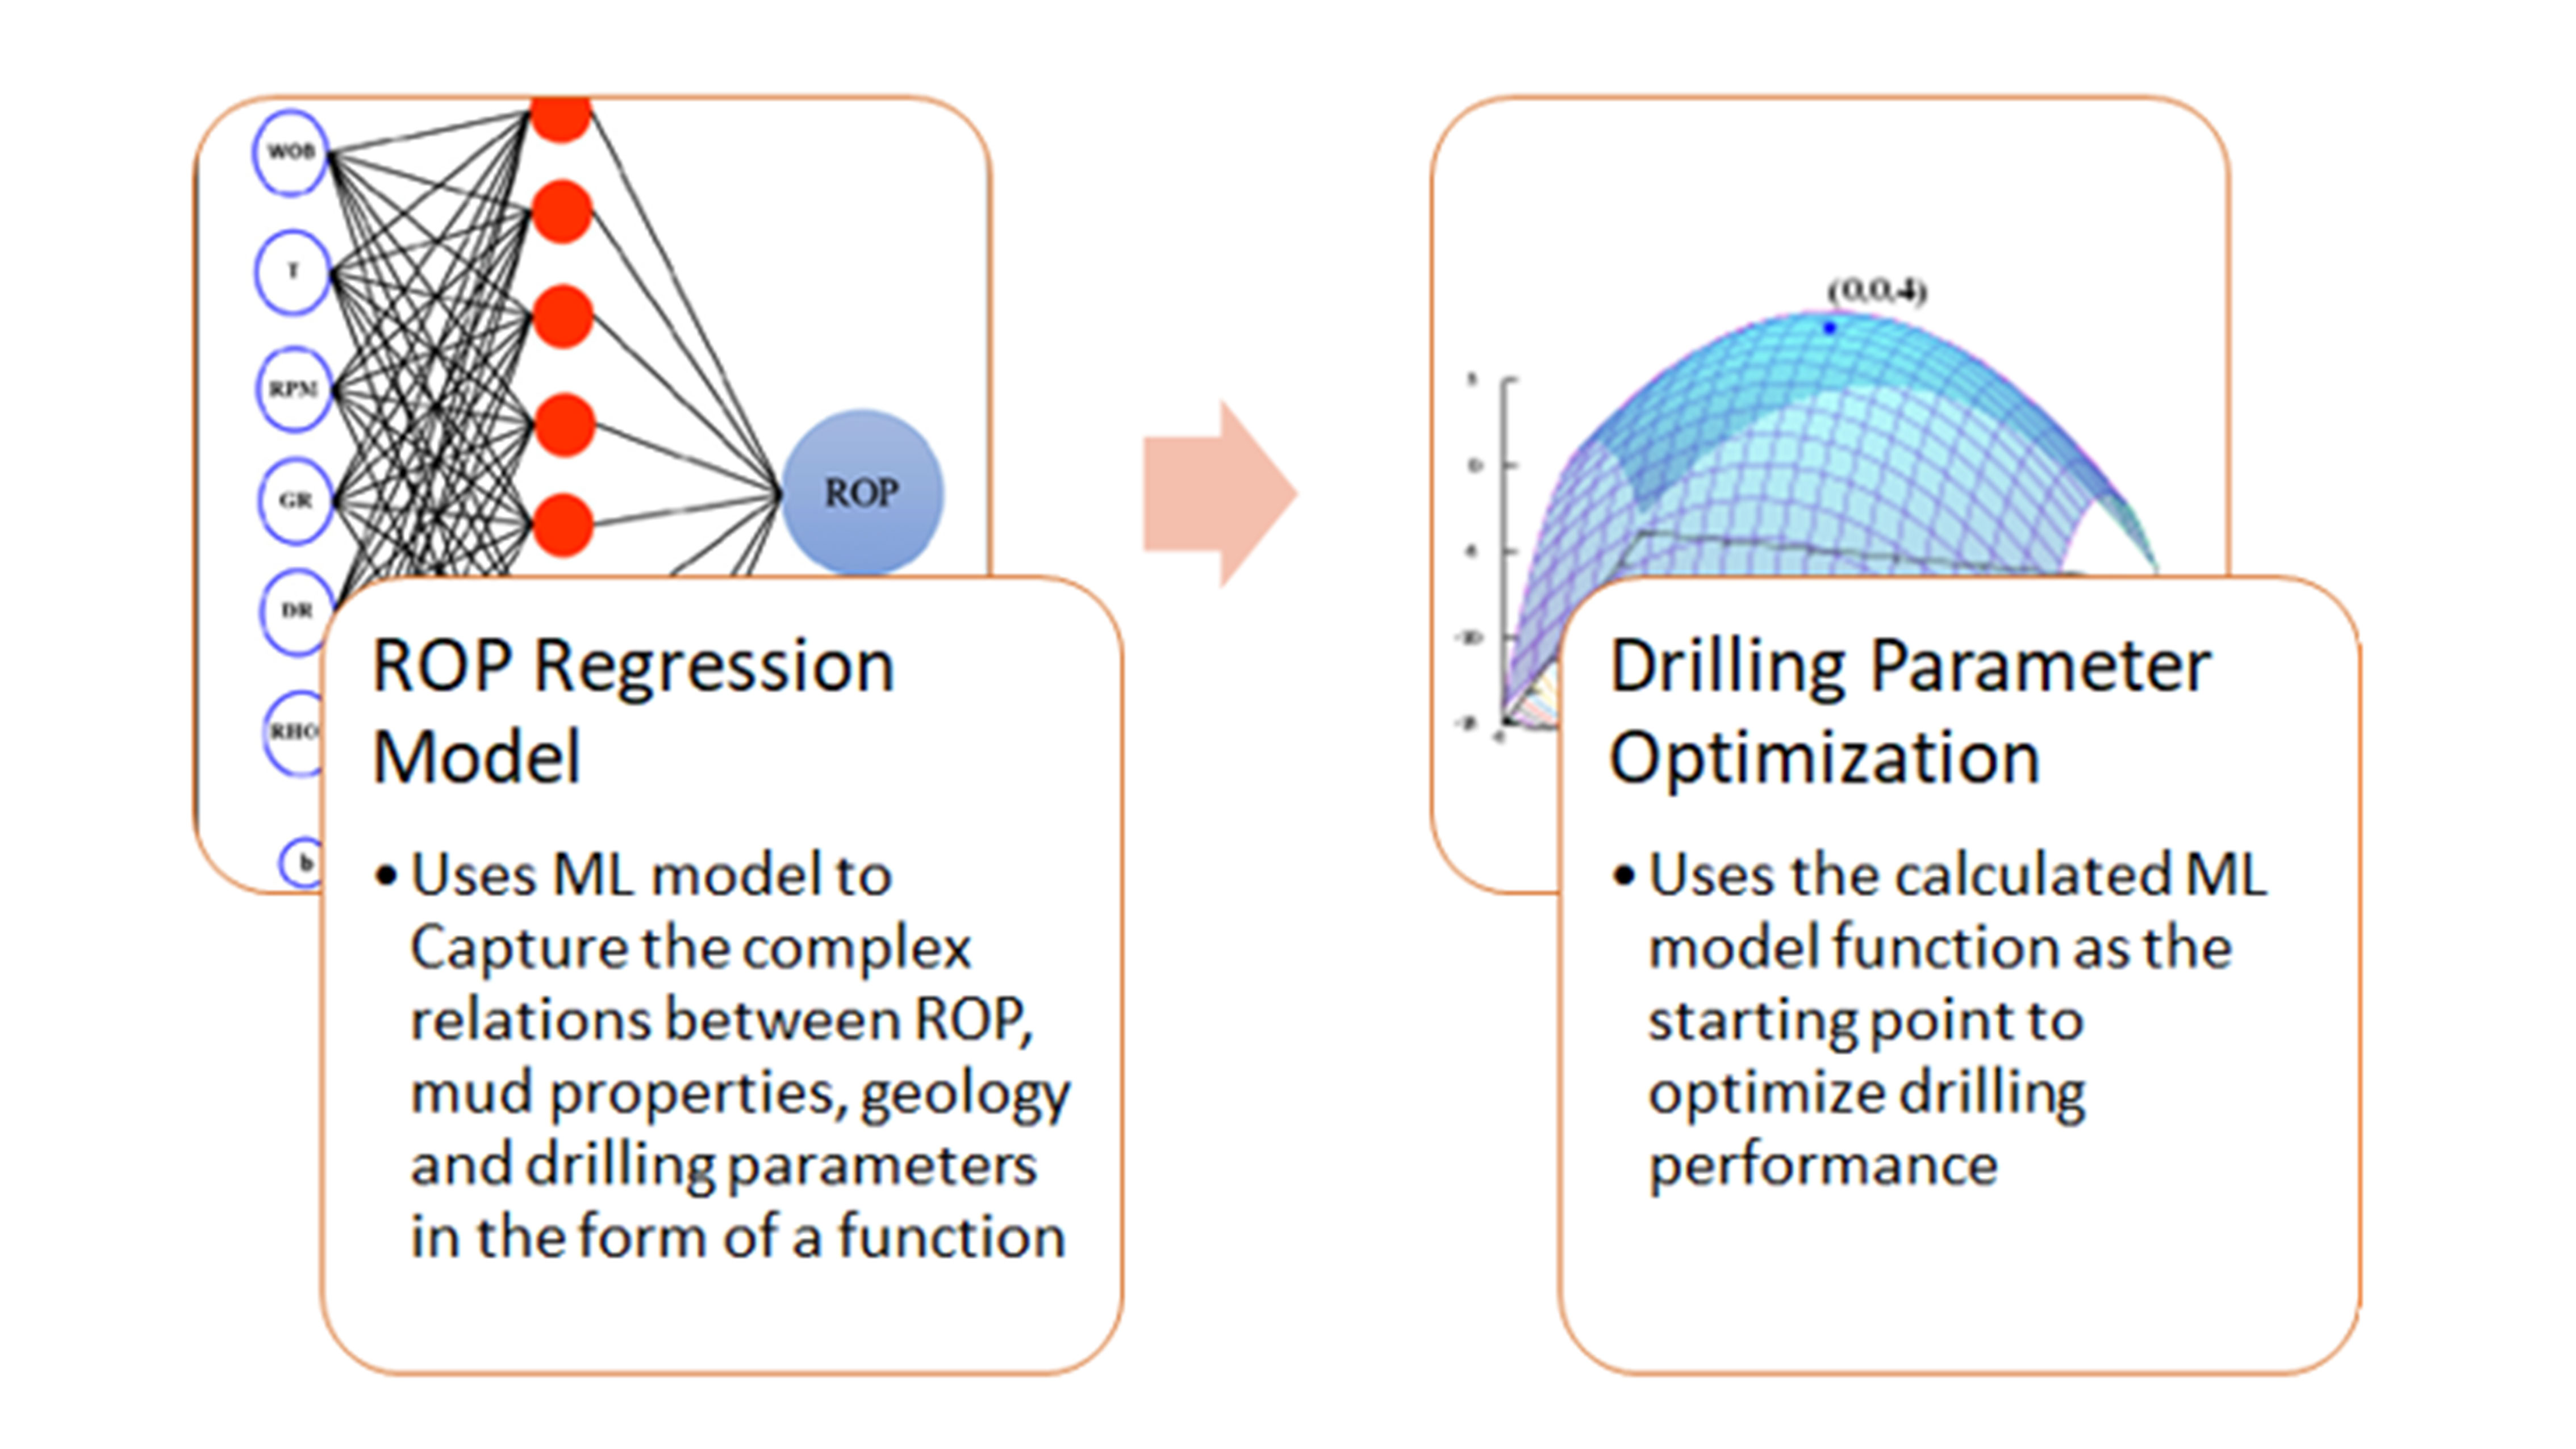
The regression results are used as input to predict the optimum ROP and associated drilling mechanics parameters values during planning and drilling operations. The algorithm essentially finds the best parameters by searching through thousands of different combinations. The ROP predictions and optimization models helps ensure up to 10-15 percent ROP improvement to the target benchmark well.
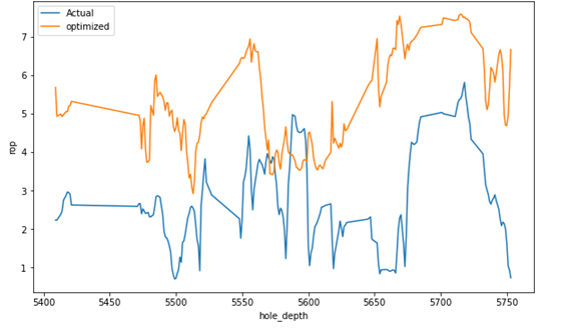
In this sample ROP optimized output diagram (Figure 3), the orange line denotes the optimized ROP values while the blue line denotes the actual ROP. The orange line indicates that the model was recommending higher ROP values for a specific hole depth which would lead to faster drilling and therefore lower costs. This result was validated with a drilling expert.
The scope of the data-driven approach proposed here was to explore the potential of creating business value using AI and ML. The test results show that the improved detection system has an accuracy of up to 90 percent. What’s more, the ROP predictions and optimization models are available as a micro service for easy integration into any workflow.
Expert: Chafaa Badis | Lead Data Scientist
Pradyumna Singh Rathore | Data Scientist
Shashwat Verma | Consultant Data Science